Twin Paradox in Phad

This scroll painting depicts a story in four scenes. The king loves the girl but his proposal of marriage is disapproved because of their age difference. The king embarks on a trip in a spaceship which can travel at speed close to light. During this period the girl ages faster than the king and is fit for marriage upon his return.
Artists: Ankit Kumar Jaiswal, Abinash Kumar, Ghule Siddharth Sambhaji, Kaushik Borah, UG 2012-2016 batch in a course taught by Dr. Bitasta Das.
Significance of zero in Jamini Roy style Kalighat painting
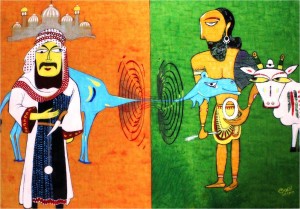
This work featuring an Indian mathematician, an Arab trader, a cow and a camel is an ode to the discovery of zero by Indian mathematician and dispersal of its significance by the Arab traders. Worm hole is introduced to connect the distinct parts of world.
Artists: Amlan Das, Saibal De, Subhajit Dasgupta, Tanmoy Pal, UG 2012-2016 batch in a course taught by Dr. Bitasta Das.
Phagocytosis in Cheriyal

The typical red colour has been maintained to show the combat between antigene and antibody against the characteristic regal setting.
Artists: Gandi Mounika, Kaivalya M, Malla Sai Prathyusha, Sabareesh R, UG 2012-2016 batch in a course taught by Dr. Bitasta Das.
Mendel’s first law of inheritance in madhubani

Retaining the traditional fish and lotus motifs this work is representational of colourful Bharni style of Madhubani
Artists: Pritish Patil, Rhine Samajdar, Sahana D. Rao, Shashank H. R., UG 2012-2016 batch in a course taught by Dr. Bitasta Das.
Human Evolution in Warli
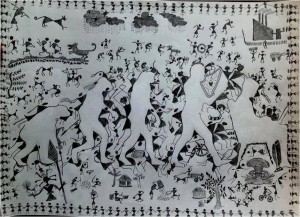
This work is a modern rendition of the Warli art. Human’s evolution from ape to Homo erectus, from books to laptop has been heightened by the progression depicted in the backdrop from tribal society to industrial society.
Artists: Arka Pal, Rohit Chatterjee, Subhendu Pandit, UG 2012-2016 batch in a course taught by Dr. Bitasta Das.
Extinction of Dinosaurs in Sohrai Painting
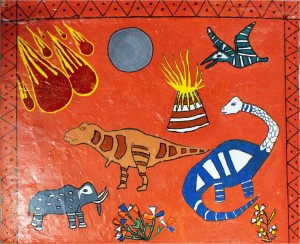
This work done on plaster of Paris gives a texture of the mud walls. Retaining the original theme of nature of the tribal art, the theory of Dinosaurs extinction by meteors is shown.
Artists: Jaspal Singh, Gagandeep singh, Kshitij yadav, Kartik Akhoon, Soumyo Biswas, UG 2012-2016 batch in a course taught by Dr. Bitasta Das.
Collatz Conjecture in Sanjh

At a metaphorical level, this work represents the principle of Unity in Diversity. It depicts that each leaf though varied from each other, ultimately rose from the same base. This is closely related to the Collatz conjecture, where every number seems to reach unity at the end of the process.
Artists: Kolhatkar Sampada C, Milind Hegde, Suhas Mahesh, Medha Shekhar, UG 2012-2016 batch in a course taught by Dr. Bitasta Das.
Metamorphosis in Church Art

Done in glass, this work depicts the transformation of a being, shaped and captured by sin, into something better and vibrant, by the process of release.
Artists: Shinjini Biswas,Shalaka Shinde,Richa Naja Jain,Siddharth Kankaria, UG 2012-2016 batch in a course taught by Dr. Bitasta Das.
Animal Evolution in Gond art
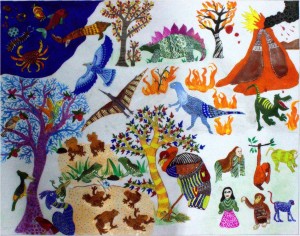
This intricate art work shows the distinctive lines and dots pattern of the Gond art form. The work shows the evolution of animal world in a flow chart.
Artists: Neethu K Varghese, Varshitha K S, Harsha Gurnani, Priyalaxita Chanda, UG 2012-2016 batch in a course taught by Dr. Bitasta Das.
Accretion in Warli
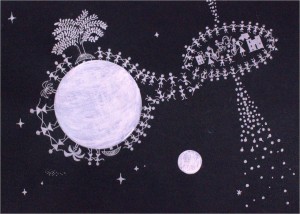
Accretion is shown here to represent urbanization. The city with its intense pull is attracting population of the nearby village, forming an accretion disk.
Artists: Debaditya Chatterjee, Kishalay De, Sandip Sinha, Sayak Ghosh, UG 2012-2016 batch in a course taught by Dr. Bitasta Das.
Elegant illustration of mitotis in C. elegance
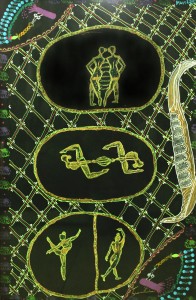
Mitosis in the one-cell stage of Caenorhabditis elegans embryo: In the C. elegans one-cell embryo, the mitotic spindle is initially set-up in the embryo centre, indicated in the topmost drawing where the gymnast pair is in the centre. However,during late-metaphase, early anaphase the mitotic spindle is displaced to the posterior side of the embryo, shown by the slight shift in the gymnast pair. Since the positioning of the mitotic spindle is asymmetric, this results in an asymmetric cell division of the one-cell embryo, producing two daughter cells with distinct fates, illustrated by the change in their pose. The ternary complex (LIN-5/GPR-1/2/Gα), that acts at the heart of this machinery along with the minus-end directed microtubules motor protein dynein is shown in the two corners.
For the lab of : Sachin Kotak
Artist: Tejeswini Padma; photo: Nireekshit Addanki
Making machines learn better
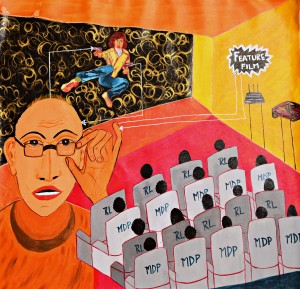
In Reinforcement Learning, the algorithm “learns” with experience by modifying, over time, the features it uses to capture the state of the system. The “actor-critic” algorithm depicts a flowchart wherein the critic (man holding his glasses) evaluates the action taken using a features-based value estimation (the feature film sticker), and gives an input to the actor (person on the screen in an action movie stance). This is used in traffic handling, both vehicular and digital as depicted by the modem and a car. The theatre seat markings stand for reinforcement learning (RL) and Markov Decision Process (MDP).
Artist: Tejeswini Padma; photo: Nireekshit Addanki
Reference:KJ Prabuchandran, ShalabhBhatnagar, and Vivek S Borkar. 2016. Actor-critic algorithms with online feature adaptation. ACM Trans. Model.Comput.Simul. 26 (4): Article 24.
A high-throughput device for cell culture
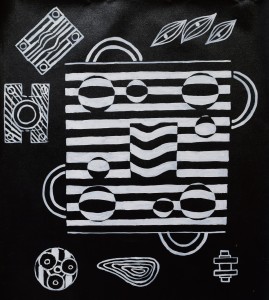
Optical art is used to represent the miniature bioreactor system that mimics in vivo conditions in cell culture. The larger circles indicate the bioreactors, while the smaller ones show the media reservoirs. I the periphery are the rotor and bioreactor structures as well as an image of the liver (to hint at hepatic cells investigated by the research group) and fibroblast cells on which various experiments were carried out by the research group.
Artist: Tejeswini Padma; photo: Nireekshit Addanki
Reference:S Balakrishnan, MS Suma, SR Raju, SDB Bhargav, S Arunima, S Das and GK Ananthasuresh. 2015. A scalable perfusion culture system with miniature peristaltic pumps for live-cell imaging assays with provision for microfabricated scaffolds.BioResearch Open Access, 4(1):343–357.
FBG devices: solving real-world problems
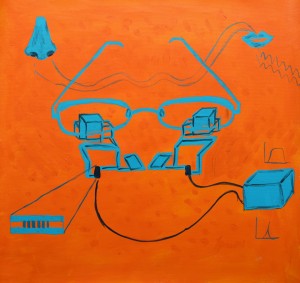
The figure shows a FBG (fibre Bragg grating)-based device (central object) that can help paralyzed patients communicate even if they are unable to speak. This wearable device senses air pressure from patient’s exhalation and instantaneously converts it into an audible signal, shown by the nasal exhalation being converted to sound waves from the mouth. Shown at the left bottom corner is the optical fibre core surrounded by a glass cladding indicating the physical construction of an optical fibre.
Artist: Tejeswini Padma; photo: Nireekshit Addanki
Reference:Srivani Padma, SharathUmesh, Shweta Pant, TalabattulaSrinivas and SundarrajanAsokan. 2016. Fiber Bragg grating sensor-based communication assistance device. J. Biomed. Opt. 21(8): 086012
A significant step in understanding climate change
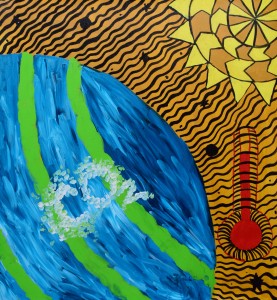
This painting depicts the earth (70% blue for water and 30% green for land) and the Sun and the black waves show the radiation exchanged. The thermometer on the right is to indicate temperature rise. The pictures also indicates that solar forcing is 80% as effective as CO2 forcing.
Artist: Tejeswini Padma; photo: Nireekshit Addanki
Reference:Angshuman Modak, Govindasamy Bala, Long Cao and Ken Caldeira. 2016. Why must a solar forcing be larger than a CO2 forcing to cause the same global mean surface temperature change? Environ. Res. Lett. 11(4):1-12
Modulating Power
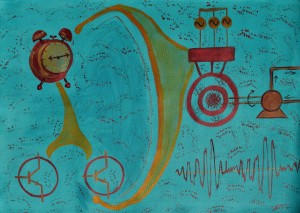
Using a standard pulse-width-modulation (PWM) method, it is possible to run an induction motor powered by AC from an inverter; oscillations of the motor current at certain low and medium speeds. The inverter has transistors, working in pairs, shown at the bottom left corners which alternately turn on and off. But there is a small sliver of “dead time”, indicated by the flat hands of the alarm clock, in the conduction cycle during which, for reasons of safety of the device, both transistors are off. They traced the erratic behavior of the motor to the inverter dead-time, and developed a model for it that better predicts the region of instability. Top right is shown the typical application of a fan/pump load driven by a variable speed induction motor.
Artist: Tejeswini Padma; photo: Nireekshit Addanki
Reference:Anirudh Guha and G Narayanan. 2016. Small-signal stability analysis of an open-loop induction motor drive including the effect of inverted deadtime. IEEE Transactions on Industry Applications. 52(1):242-253
How to beat anti-incumbency
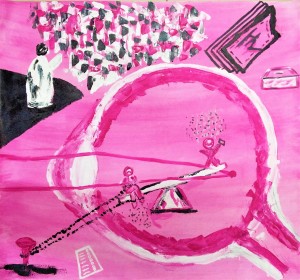
The political business cycle that arises from elections is shown here. The fine balance between inflation and unemployment is shown by the see-saw. In the broader field of optimal control theory, the idea is to control a system using feedback in order to optimize its output. In the above model, the unemployment rate is the feedback in the control process, hence being nailed to the ground. At the top is a political figure addressing the crowd. Their model also allows for a special case—dubbed “perfect myopia”—which implies that only those policy decisions announced just before elections have any impact in shoring up voter support, hence the eye figure showing the rays converging before the retina.
Artist: Tejeswini Padma; photo: Nireekshit Addanki
Reference:Gopal K Basak, Mrinal K Ghosh, and Diganta Mukherjee. 2016. A mean-reverting stochastic model for the political business cycle, Stochastic Analysis and Applications. 34(1):96-116.
Going for gold
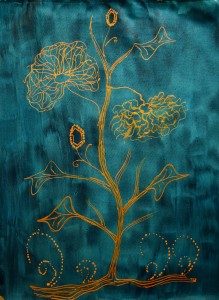
The plant represents the growth of gold nanowires which are about 5-6 atoms thick. The buds represent the gold crystals. The flowers mimic the SEM images displaying the uniform growth of high aspect ratio ultrathin Au nanowires. Cyclic voltametry plots are used to show the leaves, while the Nyquist plots are used to show grass.One of the applications is the use of gold nanowires as reaction catalysts for fuel cells.
Artist: Tejeswini Padma; photo: Nireekshit Addanki
References:A Leelavathi, R Ahmad, AK Singh, G Madras and B Ravishankar. 2015. Graphene-oxide-supported ultrathin Au nanowires: efficient electrocatalysts for borohydride oxidation. Chem. Communication.51:16856-16859
Beating HIV at its own game
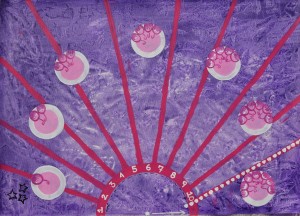
The quasi- species theorystates that due to high rates of mutation a virus might lose its genetic information. Using this a threshold level for HIV has been identified which states that if the mutation rate exceeds beyond 6 times( shown by circles containing different number of mutations), then the virus can lose its efficiency. Using drugs that accelerate the mutation rate of HIV, shown in black as the stars, the virus can be rendered inactive over a period of 10 years depicted as the 10 divisions of the timescale, while the dotted line represents the threshold.
Artist: Tejeswini Padma; photo: Nireekshit Addanki
Reference:Gupta, V, Dixit, N. 2015. Scaling law characterizing the dynamics of the transition of HIV-1 to error catastrophe.Phys. Biol. 12(5): 054001
Pacemaker channels regulate the brain’s local field potential
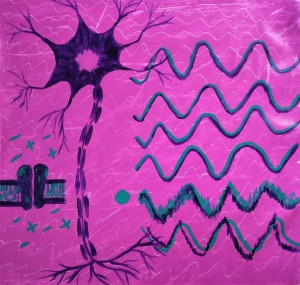
One class of electrical signals generated in the brain is called Local field potential (LFP). The study investigates how a class of electrical signals generated in the brain is called Local field potential (LFP) are generated. It uncovers a distinct role for neuronal pacemaker channels formally referred to as the hyperpolarization-activated cyclic nucleotide-gated (HCN) channels in this regulation. The neuron and the ion channel is shown on the left, while the right half of the painting shows the alteration in phase brought about by HCN channels.
Artist: Tejeswini Padma photo: Nireekshit Addanki
Reference:ManishaSinha and Rishikesh Narayanan. 2015. HCN channels enhance spike phase coherence and regulate the phase of spikes and lfpsin the theta-frequency range. Proceedings of the National Academy of Sciences (USA). 112(17): E2207-E2216.
Large Impact Through Small Devices

Research is this lab seeks to develop nano-sensors. In this painting, gas sensors are shown at the bottom. These sensors can detect carbon dioxide in the range of 300 to 1000 parts per million. At the base is silicon, followed by silicon dioxide, then copper and finally titanium or platinum contact electrodes.
At the top is a phablet-sized handheld device, being commercialised under a company PathShodh Healthcare, that can perform these multiple tests related to diabetes management in less than a minute, using no more than a drop of blood or urine: sensing of HbA1c (glycated haemoglobin), glycated albumin, blood glucose, haemoglobin, serum albumin, micro-albuminuria, urine creatinine and urine ACR (each represented by the colourful hanging structures).
Artist: Tejeswini Padma; photo: Nireekshit Addanki
Reference:KL Ganapathi, S. Bhattacharjee, S Mohan, and N Bhat. 2016. High-performance HfO2 back gated multilayer MoS2 transistors. IEEE Electron Device Letters. 37(6):797-800
SB Rudraswamy, N Bhat. 2016. Optimization of RF sputtered Ag-doped BaTiO3-CuO mixed oxide thin film as carbon dioxide sensor for environmental pollution monitoring application. IEEE Sensors Journal. 16(13):5145-5151
Paper discs for detecting enzymes
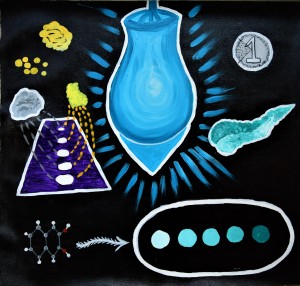
Lipase is a pancreatic enzyme that breaks down fats (large yellow blob on the left corner) into fatty acids and glycerol (smaller yellow drops) during the process of digestion. The detection of lipase is carried out by a biosensor. It is a paper disc, embedded within which is a gel made with terbium (grey mass) and doped with a synthetic enzyme substrate (lemon yellow mass with dotted lines depicting the doping process). When in contact with lipase, the disc turns green when illuminated under UV light (shown as the central blue lamp). The enzyme amount is measured by the change in intensity, shown by the different tones of green. Each if these discs costs merely one-fifth of a rupee!
Artist: Tejeswini Padma; photo: Nireekshit Addanki
Reference:TumpaGorai and UdayMaitra. 2016. Supramolecular approach to enzyme sensing on paper discs using lanthanide photoluminescence. ACS Sensors. 1(7):934–940
Commercial ventures that originated in IISc

The start-up spirit is in the air in IISc. A number of students and some faculty are taking up the challenge of transferring their technology into the marketplace. The motifs in this image capture the technological ventures started by IISc entrepreneurs in the last two years. The legs of the painting lady represent a compliant mechanism that forms the basis for an IISc spinoff company, BendFlex . The tap and bucket of water on the left side indicate Open Water, another start-up company that can cleanse dirty water and make it potable. The mosquito and the blood-drop allude to a Point-of-Care malaria detection device developed by another entrepreneur in IISc (SciDogma). The DNA strand on a phablet stands for Path Shodh that promises cost-effective and accurate diabetic tests. Astrome is a start-up company that will deliver high-speed internet via satellite communication is captured by the two images at the bottom. Overall, this abstract image is an artistic compilation of real commercial ventures that originated in IISc.
Reference: Connect, Sep. 2016, issue. pp. 4-8. (An Article by Suhas Mahesh);
Painting credit: Tejeswini Padma.
Mycobacterial enzymes: Mechanisms of cAMP synthesis and degradation
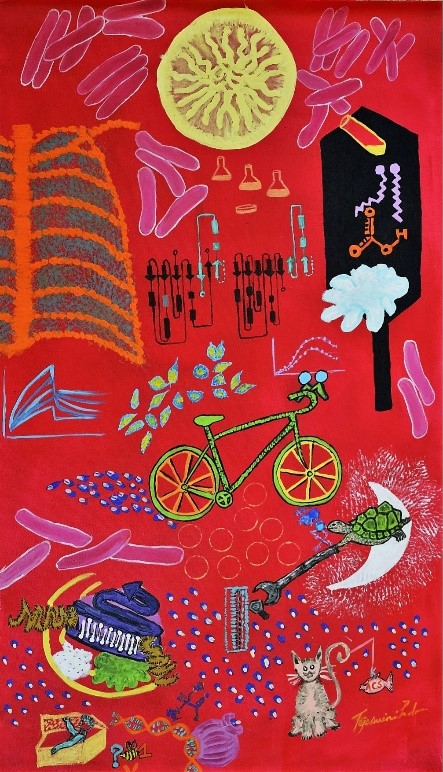
This image represents the studies in Prof. Sandhya S. Visweswariah’s laboratory, which are related to novel enzymes that synthesise cyclic adenosine monophosphate (cAMP) in Mycobacteria, the proteins that degrade cAMP, and use cAMP to bring about changes in the mycobacterial cell.
An X-ray picture of the chest at the top-left side indicates that the standard way of diagnosing tuberculosis, which is caused by Mycobacterium tuberculosis. Bacteria as well as colonies of bacteria are depicted at the top.
An additional technical detail is that Adenylyl cyclases (AC) synthesise cyclic AMP from ATP, and they are broken down by phosphodiesterases (PDE). The cycle denotes ACs, with eight spokes in the wheels of the bicycle, to indicate 16 putative cyclases in the genome of Mycobacterium tuberculosis. The two blue horns on the bicycle denote the two metal ions required for catalysis. The traffic signal (shown in black on the right side of the image) showcases fatty acids, pH, bicarbonate, and macrophage infection that act as signals to activate the ACs.
The blue and cream beads represent cAMP that is produced in large amounts. The tortoise, indicative of a PDE in slow-growing Mycobacteria, is shown wielding a wrench to alter the cell wall.
Cyclic AMP also binds to and activates CRPs, CRPMt and Cmr, resulting in transcription of genes essential for serine biosynthesis, resuscitation (shown by the man rising from the coffin at the lower left corner) and development. The sandwich platter a little away from the lower left corner depicts the structure of the CNB domain. The cat with the ACS fish as bait, in the lower right corner, represents the function of the KATmt enzyme.
Related Publications:
- A Universal Stress Protein (USP) in Mycobacteria Binds cAMP. J Biol Chem. 2015 May 15; 290(20):12731-43. doi: 10.1042/BJ2015002
- Cyclic AMP-dependent protein lysine acylation in mycobacteria regulates fatty acid and propionate metabolism. Nambi S, Gupta K, Bhattacharyya M, Ramakrishnan P, Ravikumar V, Siddiqui N, Thomas AT, Visweswariah SS. J Biol Chem. 2013 May 17;288(20):14114-24. doi: 10.1074/jbc.M113.463992. Epub 2013 Apr 3. PMID: 23553634
- Cyclic AMP-induced conformational changes in mycobacterial protein acetyltransferases. Nambi S, Badireddy S, Visweswariah SS, Anand GS, J Biol Chem. 2012 May 25;287(22):18115-29. doi: 10.1074/jbc.M111.328112. Epub 2012 Mar 24.
- cAMP-regulated protein lysine acetylases in mycobacteria. Nambi S, Basu N, Visweswariah SS. J Biol Chem. 2010 Aug 6;285(32):24313-23. doi: 10.1074/jbc.M110.118398. Epub 2010 May 27. PMID: 20507997
- Mycobacterial adenylyl cyclases: biochemical diversity and structural plasticity. http://dx.doi.org/10.1016/j.febslet.2006.05.034
- The Rv0805 gene from Mycobacterium tuberculosis encodes a 3′,5′-cyclic nucleotide phosphodiesterase: biochemical and mutational analysis. 2005 Dec 6; 44(48):15695-704.
Guanylyl Cyclase C in the Gut
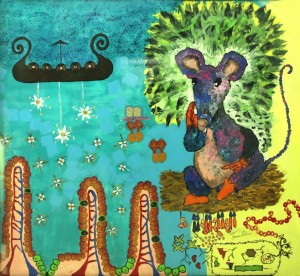
Prof. Sandhya Visweswariah’s laboratory has been discovering the roles of cyclic nucleotides in mammals as well as in mycobacteria. She and her students have identified mechanisms that are regulated by a receptor present in the gut called GC-C, which is the target of bacterial toxins that cause watery diarrhoea.
Depicted prominently at the bottom of the image are the gut villi with their epithelial cells covering them and capillaries inside. The mouse indicates the models that are used to study the role of GC-C in gut biology. The flowers above the villi represent the peptides that bind to GC-C and activate the receptor. There are three types that represent three GC-C ligands, two with four petals and one with six petals, which indicate the number of cysteines present in the peptides.
In a collaboration with Norwegian Clinicians at the University of Bergen (alluded to with a Viking boat in the picture), as well as in Innsbruck Medical College, Austria, Prof. Visweswariah’s laboratory has characterised the first mutations in GC-C that are the cause of gut disease in humans. The hyperactivating mutations cause abdominal distention due to dilated fluid-filled loops of the intestine. The mouse with the bloated abdomen represents this swelling.
Related Publications:
- Congenital secretory diarrhoea caused by activating germline mutations in GUCY2C. Gut, 2015, doi:10.1136/gutjnl-2015-309441;
- New England Journal of Medicine, 2012, doi: 10.1056/NEJMoa1110132).
- The multiple and enigmatic roles of guanylyl cyclase C in intestinal homeostasis. FEBS Lett. 2012 Aug 31; 586(18):2835-40.
- Cyclic nucleotide signalling in intestinal epithelia: getting to the gut of the matter. Wiley Interdiscip Rev Syst Biol Med. 2013 Jul-Aug;5(4):409-24.
Evolutionary conservation of cyclic nucleotide phosphodiesterases
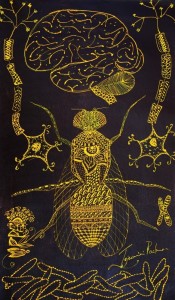
Recent in silico analysis revealed the presence of Class III cyclic nucleotide phosphodiesterases in bacteria, archae and eukaryotes. During the course of investigations in Prof. Sandhya S. Visweswariah’s laboratory, it was discovered that a protein in Mycobacteria was present in a similar form in higher organisms including humans. This protein is expressed in the brain and the nervous tissue, as depicted in the picture. The function of this protein is unknown and research in the laboratory uses the power of genetics and the fruit fly (Drosophila melanogaster) to demonstrate that this protein is important in increasing the life span in the fly.
The rod-shaped clusters at the bottom of the image denote Mycobacteria, The Drosophila (fruit fly) and the neurons on either side portray the relevance of this work in the eukaryotic system.
Related Publications:
- Metallophosphoesterases: structural fidelity with functional promiscuity. Biochem J. 2015 Apr 15;467(2): 201-16.
- A mycobacterial cyclic AMP phosphodiesterase that moonlights as a modifier of cell wall permeability. Biol. Chem. 2009 Nov 20;284(47):32846-57. doi: 10.1074/jbc.M805996200.
- Characterization of an evolutionary conserved metallophosphoesterase that is expressed in the fetal brain and associated with the WAGR syndrome. Biol. Chem. 284: 5217 – 5228. doi: 10.1074/jbc.M805996200.


