Interpreting ‘black-box’ machine learning to guide materials discovery
Machine learning (ML) algorithms learn the hidden pattern in the given (or training) data by themselves and use it to predict on unseen data at a much faster rate than collecting the original data. However, such methods are entirely statistical, and it is very difficult to uncover the pattern learned by the ML models, essentially due to their ‘black-box’ nature. In this work, IISc researchers led by Abhishek Kumar Singh, Professor at Materials Research Center, have developed highly accurate but ‘interpretable’ ML (iML) models to predict the stable two-dimensional (2D) materials in a high-throughput (HT) manner.
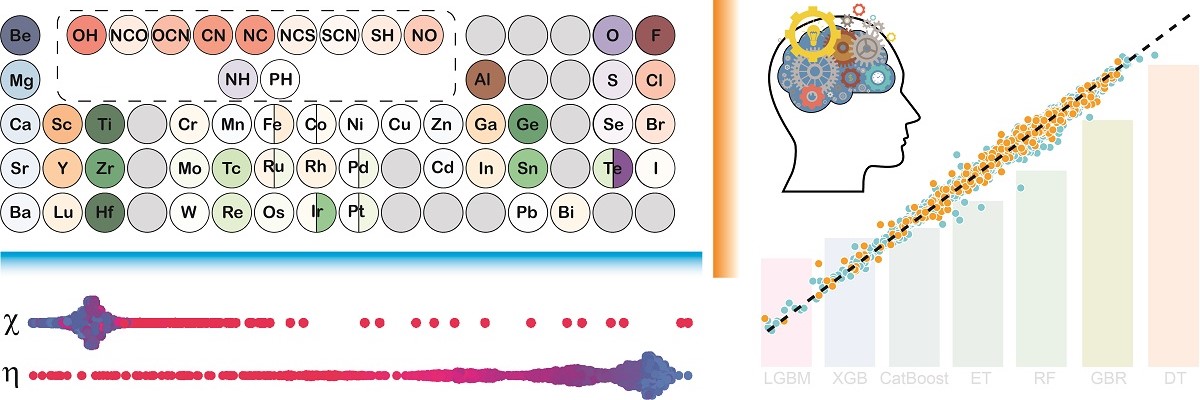
A database of around 3000 2D materials, called the 2DO database, was created for carrying out this study. A total of three sets of features were generated for the 2D materials, i.e., elemental, structural, and chemical hardness were used for developing the ML. Attempts to explain the ML predictions through conventional methods such as feature importance result in physically inconsistent correlations between the feature and the target property. The SHAP (SHapley Additive exPlanations) method was employed to gain accurate insights that are in line with the existing chemical principles of ionic character and HSAB (hard and soft acids and bases) principle. The SHAP interpretability also established the usage of more intuitive chemical hardness features over the structural features for the case of linkage isomers (have the same composition but different bond connectivities), where the elemental features fail.
The 2DO database will be uploaded on the aNaNt website managed by our group. The relevant data and codes for reproducing the work are available on GitHub. This work was funded by the Institute of Eminence (IoE) grant.
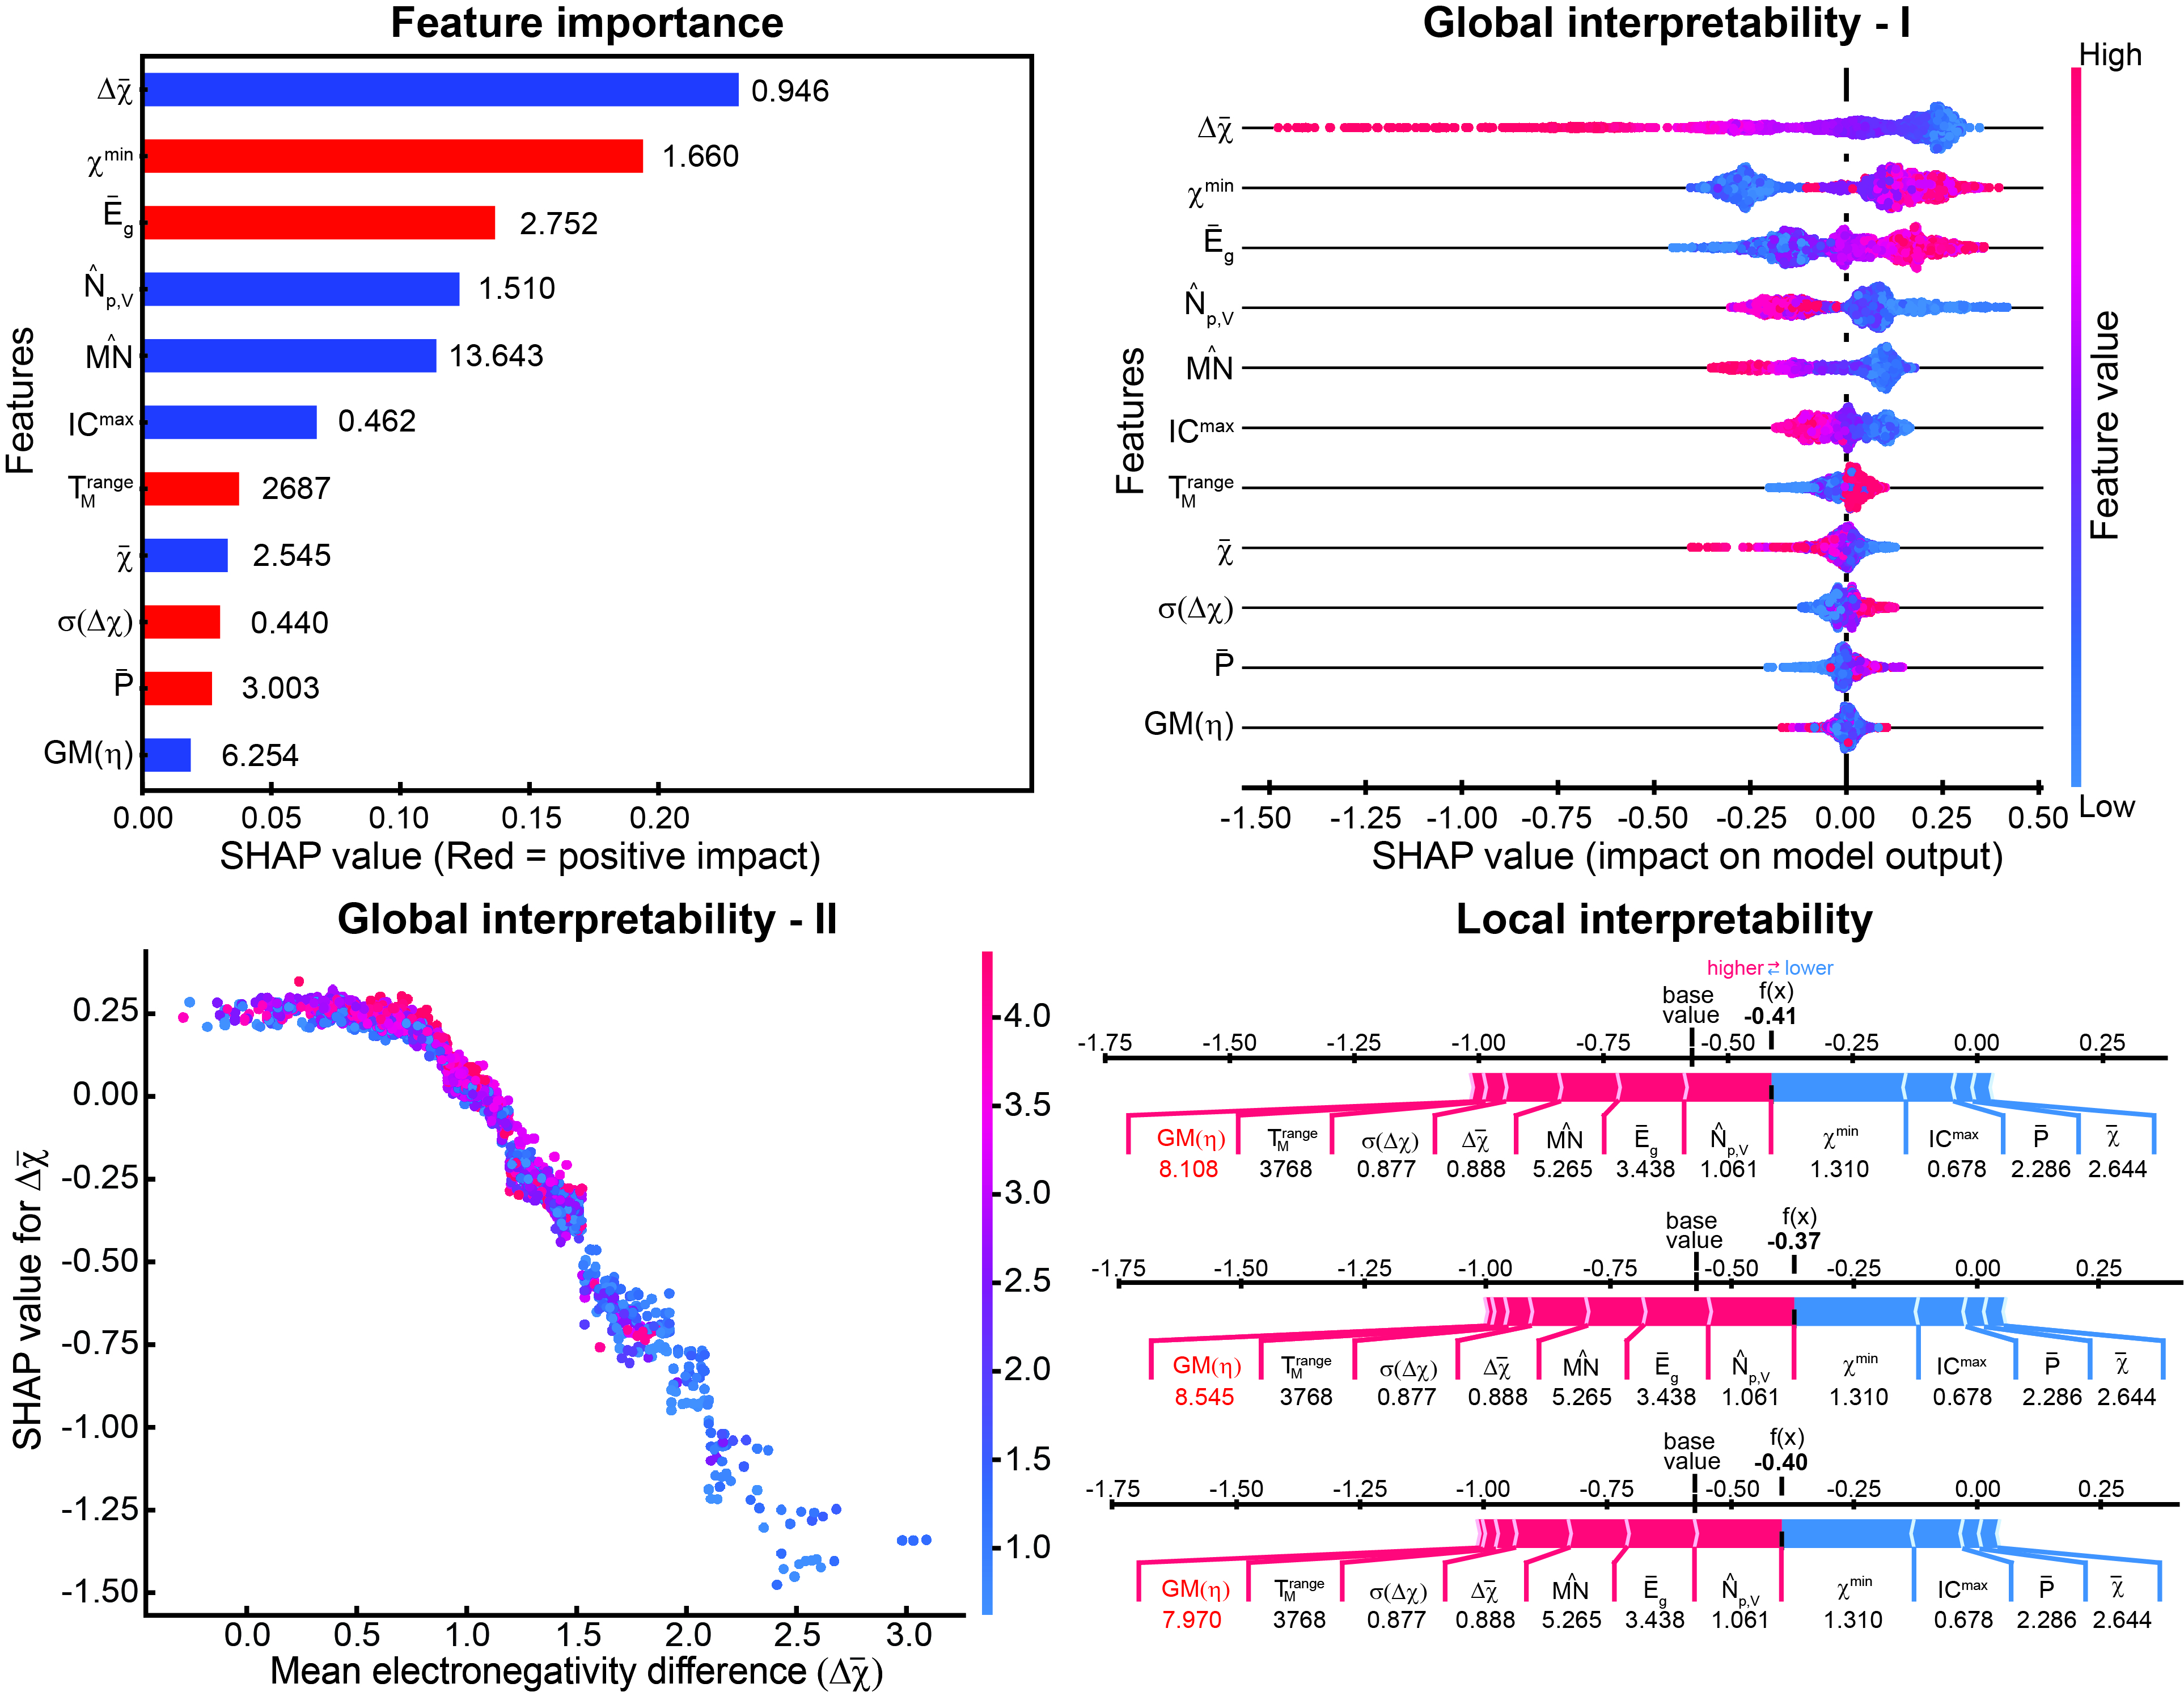
Top row: (Left) Typical feature importance plot obtained for an ML model, in which the extent of interpretability is limited and correlation of the feature with the target property may not be correct. (Right) SHAP summary plot shows the exact correlation of each feature with the target property compared to the plot on the left that depicts only positive or negative correlations. Bottom row: (Left) SHAP dependence plot, which provides more detailed insights into the SHAP summary plot for each feature, shows the dependence of the target property (formation energy) on one of the features (mean electronegativity difference). The trend was verified from an existing chemical relationship of ionic character with electronegativity difference. (Right) SHAP force plot depicting the effect of the features on individual data points, which can extract valuable insights into the ML predictions for specific data points, i.e., for linkage isomers in this case.
Reference: R. Kumar and A. K. Singh, Chemical hardness-driven interpretable machine learning approach for rapid discovery of photocatalysts, npj Computational Materials, 7, 197, (2021)
Website URL: http://mrc.iisc.ac.in/abhishek/, http://anant.mrc.iisc.ac.in/